13. Bad Visual Quizzes (Part II)
SOLUTION:
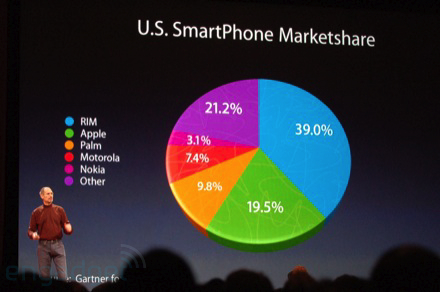
Design IntegritySOLUTION:
- Change the coloring to be less dramatic, while still relating to the different companies.
- Remove 3D aspect.
- Use a visual that uses length (bar chart) rather than area (pie chart) to demonstrate differences, as humans are better able detect differences in lengths.
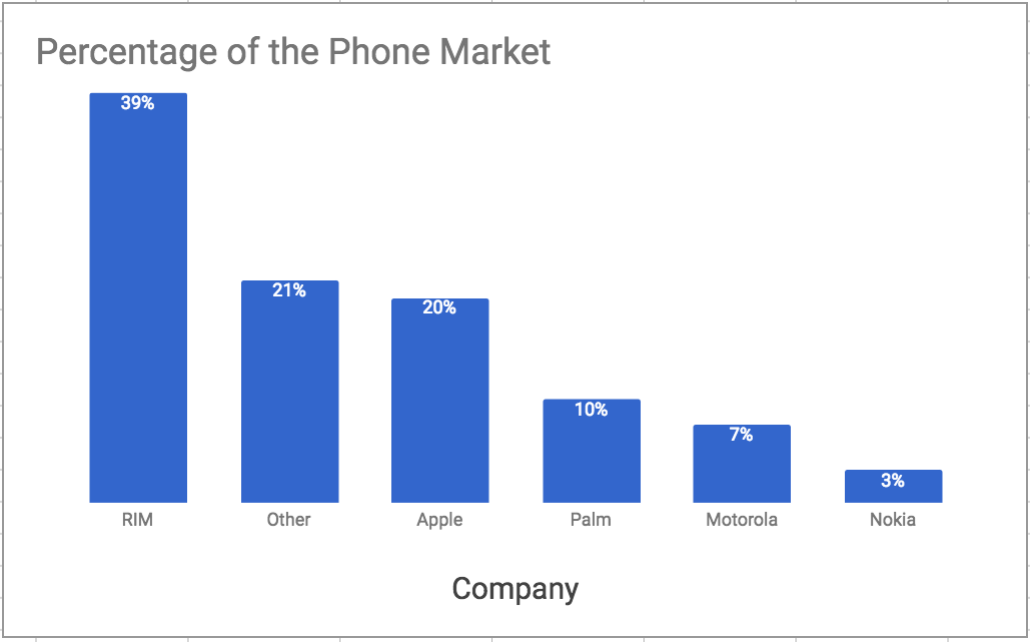
Updated Visual
The same data presented in the image above is recorded in the spreadsheet here. This data was used to create the following visual; the next question asks how this plot could be improved.
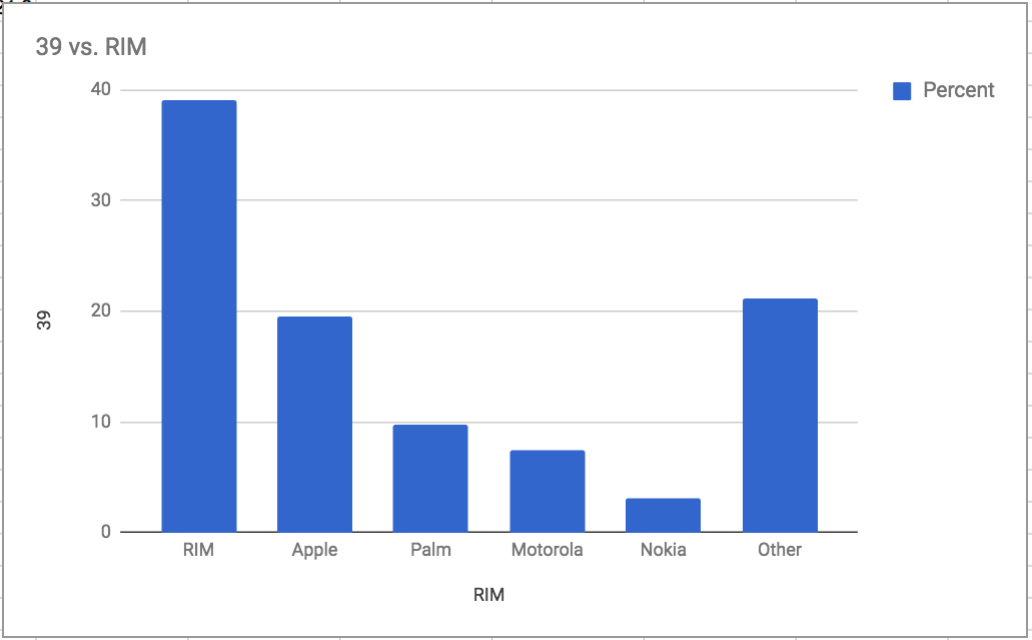
SOLUTION:
- Rename axis labels and title.
- Order the bars according to height for an easier comparison.
- Remove legend, as percent isn't a useful legend label.
There are always personal preferences. The visual below is a good visualization of this data from a design, following the principles of:
- reducing chart junk,
- maintaining a high data-ink ratio,
- maintaining data integrity, and
- using length to show changes and differences rather than areas.